Mapping of Marcellus Shale Core Samples by LIBS
by Jinesh Jain and Dustin McIntyre, National Energy Technology Laboratory
 There are numerous shale formations world-wide that have oil and natural gas trapped within the tiny pore spaces of the shale and are considered the largest natural gas deposits. These formations known as “unconventional shale reservoirs” are, therefore, being actively evaluated for their potentially large hydrocarbon reserves. Since the gas capacity of the formations can be correlated with the inorganic and organic constituents of the shale, it is critical to understand the mineralogy and overall chemical constituency of these minerals. A physical and chemical correlation between metals and organic materials can be used to determine the amount of natural gas present in the shale rocks.
The knowledge of mineralogy and geochemistry of the shale can not only predict potential drilling problems, but allow engineering and production decisions in the reservoirs, which are crucial factors that influence the decisions about drilling locations. Currently used analytical techniques for shale core logging/mapping are unable to measure all the required elements simultaneously.
Using LIBS (Laser-Induced Breakdown Spectroscopy) for shale core analysis is advantageous because it enables a rapid in situ analysis with little or no sample preparation and can provide multi-elemental analysis including C, H, N, O of a given sample.
Shale samples taken from a Marcellus gas well at depths ranging from 7498-7551 feet were analyzed using Applied Spectra, Inc.’s J200 LIBS instrument. The instrument utilized a 266 nm Nd:YAG nanosecond pulse duration laser and an 81 x 81 grid pattern that covered an 8 x 8 mm area. The data collected for Al, Ca, Fe, Mg, Si, C, H, and O from these experiments were used to construct 2D elemental maps for each sample. The representative data for Al are shown in Fig 1.
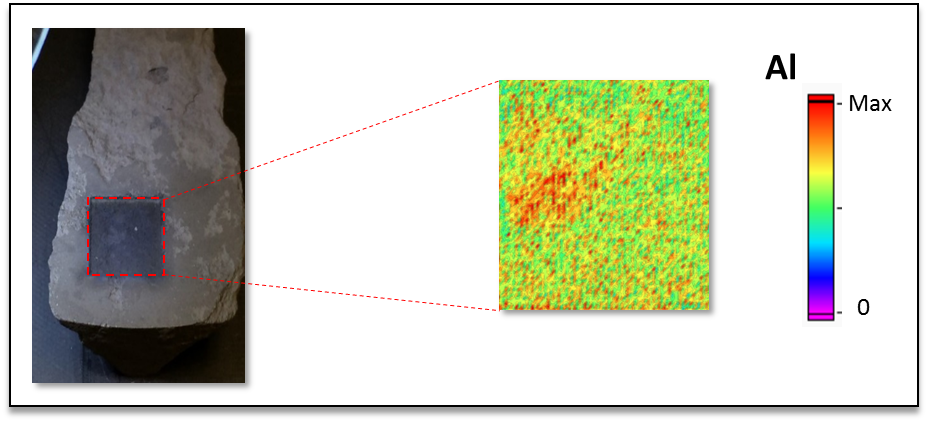 Figure 1
Samples taken from various depths of Marcellus shale wells were also analyzed for all the above elements. A depth comparison of two samples for C and H is presented in Fig 2.
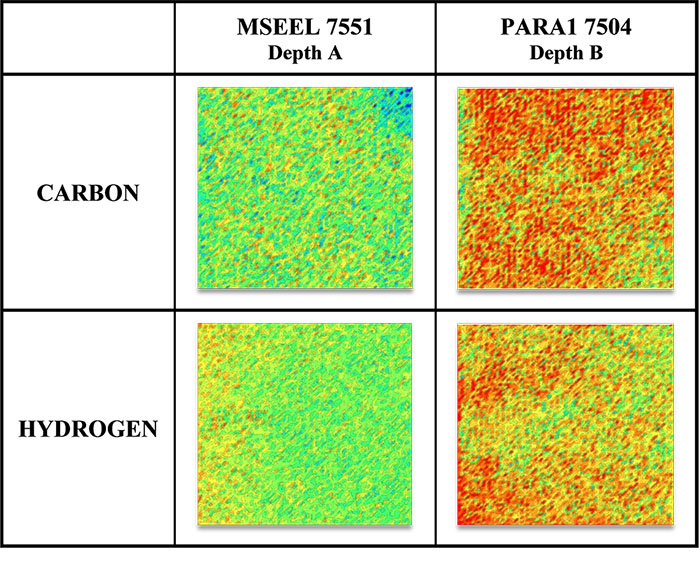 Figure 2
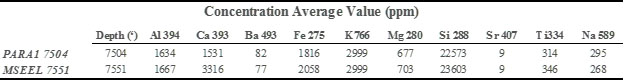
The samples retrieved from depth B are enriched in both C and H as compared to sample A. This study shows how the spatial elemental (including C and H) composition varies as a function of the sample depth and location and illustrates the benefits of LIBS over existing analytical techniques. The data can also be utilized for quantifying these elements in shale (Table-1).
Table 1